性能调优工具OSProfiler
OSProfiler是Mirantis开发的用于做性能调试的工具,以切面编程的方式在程序中嵌入埋点,并将收集到的信息已MQ方式发送到ceilometer服务中, ceilometer将这些采样数据汇总,而后我们可以通过Ceilometer API来查看这些Profiler数据。
以cinder组件为例,我们来看一下使用方式
修改cinder的配置 启用profiler ,并重启cinder服务:
[profiler]
profiler_enabled = True
trace_sqlalchemy = True
修改私有的hmac_keys,配置文件在cinder的api-paste.ini文件中:
[filter:osprofiler]
paste.filter_factory = osprofiler.web:WsgiMiddleware.factory
hmac_keys = SECRET_KEY  # 可以替换成自己的
enabled = yes
修改ceilometer配置,使其能够保存profiler采样数据,并重启ceilometer服务:
[event]
drop_unmatched_notifications = False
[notification]
store_events = True
disable_non_metric_meters = False
创建一块云硬盘并跟踪profiler信息:
$ cinder --profile SECRET_KEY create 5 --name test-profile-5
+---------------------------------------+--------------------------------------+
|                Property               |                Value                 |
+---------------------------------------+--------------------------------------+
|              attachments              |                  []                  |
|           availability_zone           |                 nova                 |
|                bootable               |                false                 |
|          consistencygroup_id          |                 None                 |
|               created_at              |      2015-11-02T02:28:09.000000      |
|              description              |                 None                 |
|               encrypted               |                False                 |
|                   id                  | 4aab5bb7-aae6-4613-ad5a-13c6600b3c8f |
|                metadata               |                  {}                  |
|            migration_status           |                 None                 |
|              multiattach              |                False                 |
|                  name                 |            test-profile-5            |
|         os-vol-host-attr:host         |                 None                 |
|     os-vol-mig-status-attr:migstat    |                 None                 |
|     os-vol-mig-status-attr:name_id    |                 None                 |
|      os-vol-tenant-attr:tenant_id     |   5e30ecc3c3434f24aa56801467ef1688   |
|   os-volume-replication:driver_data   |                 None                 |
| os-volume-replication:extended_status |                 None                 |
|           replication_status          |               disabled               |
|                  size                 |                  5                   |
|              snapshot_id              |                 None                 |
|              source_volid             |                 None                 |
|                 status                |               creating               |
|                user_id                |   7e7c411d5d314d5a818361c19b85114c   |
|              volume_type              |                 None                 |
+---------------------------------------+--------------------------------------+
Trace ID: 141925fb-c765-4a79-8522-160a091bd2ee
To display trace use next command:
osprofiler trace show --html 141925fb-c765-4a79-8522-160a091bd2ee
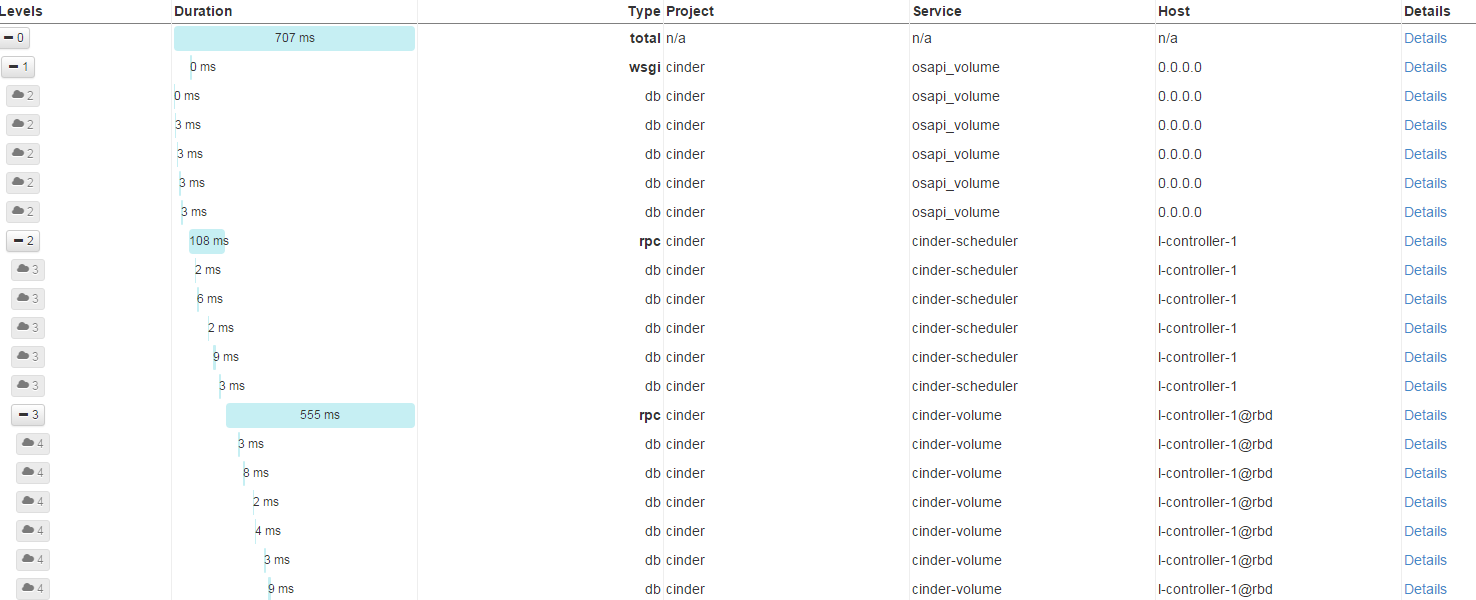
执行最后提示的osprofiler命令即可查看最终结果,结果样例类似这样: